


 (1)")

| Control | ||
|---|---|---|
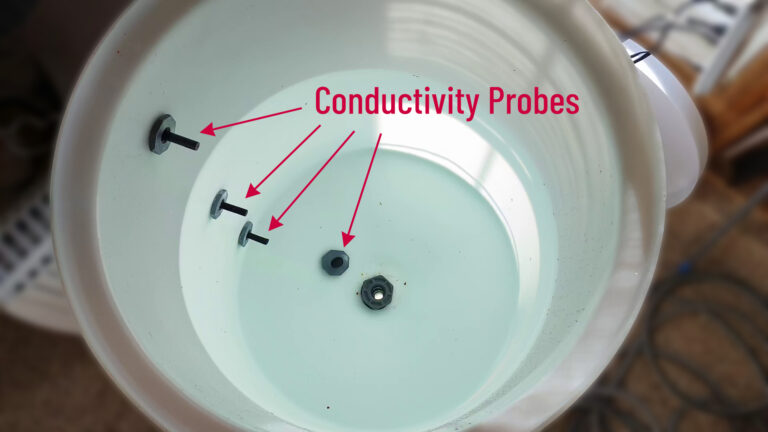
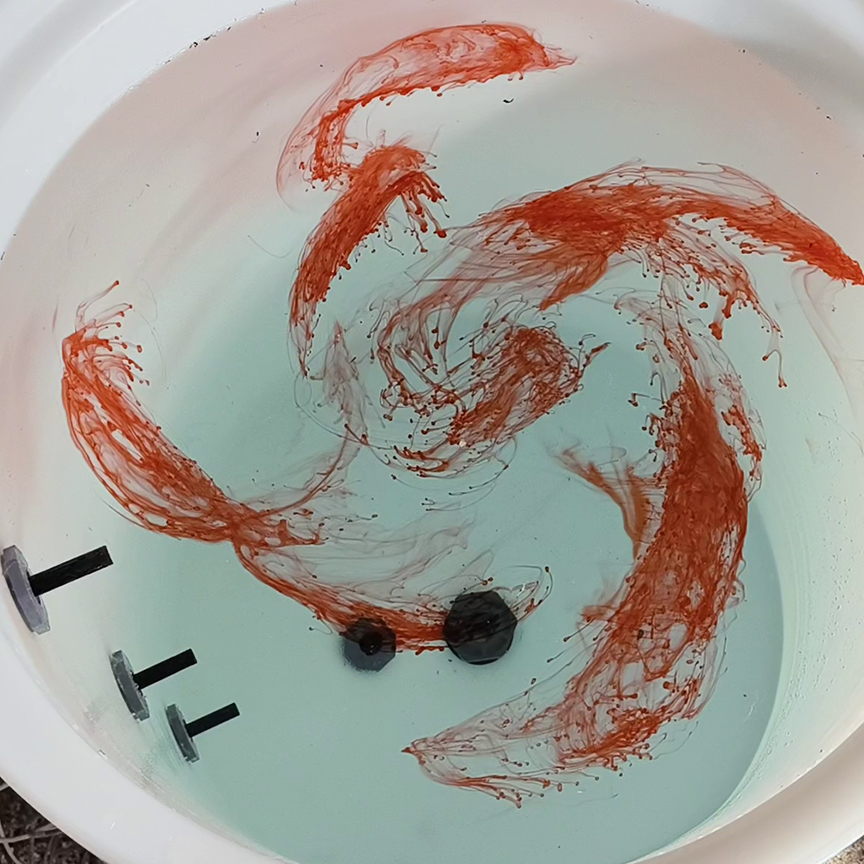
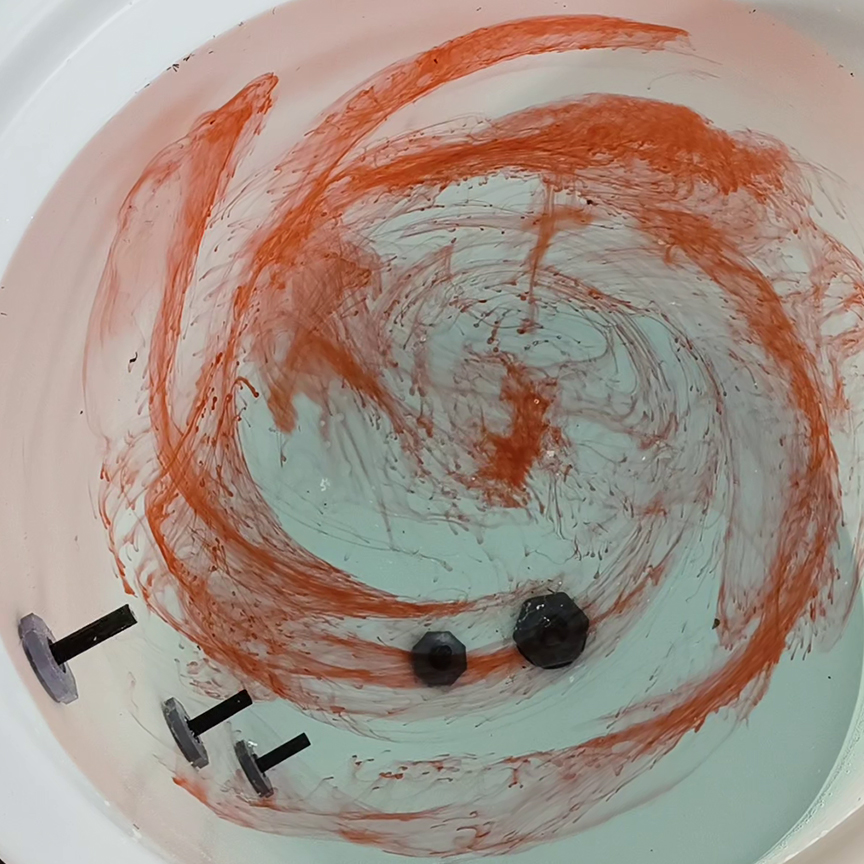
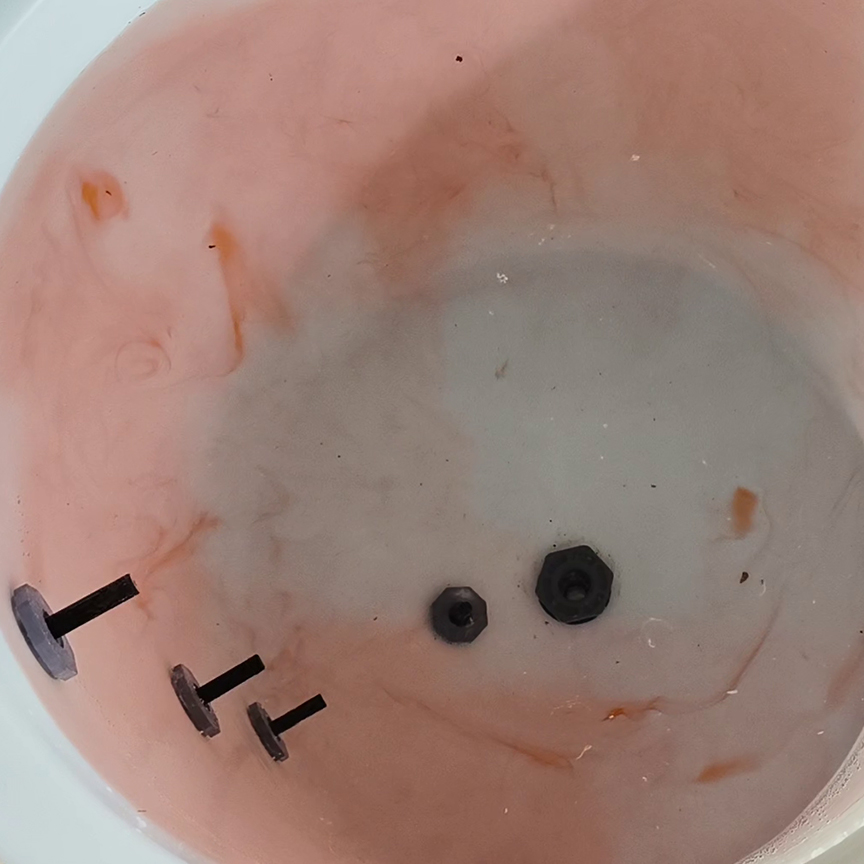
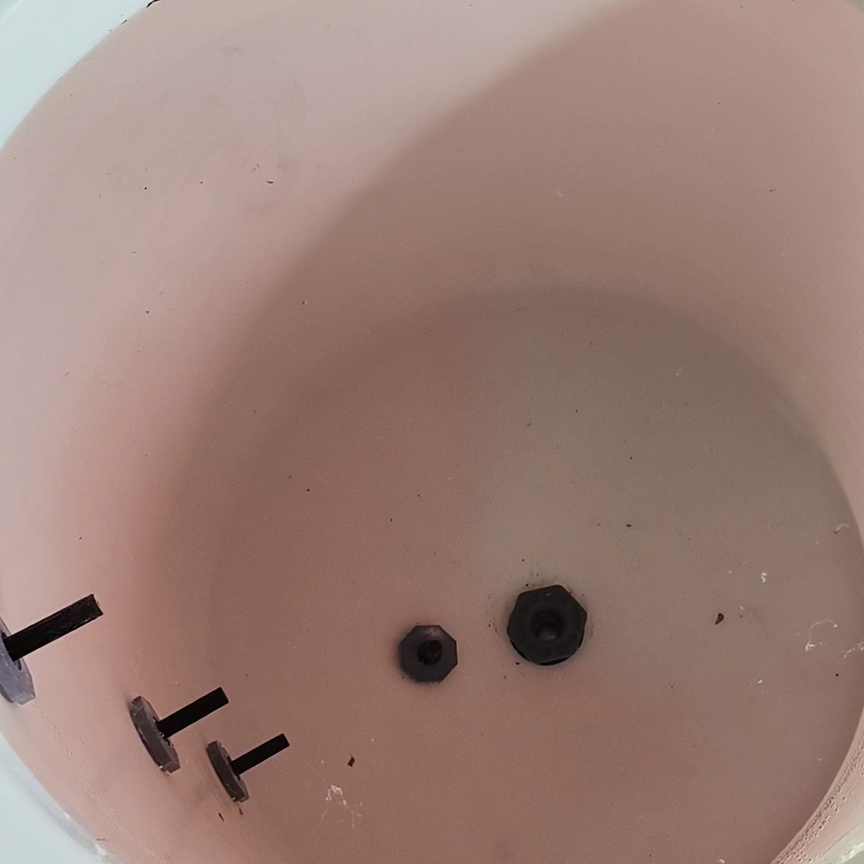
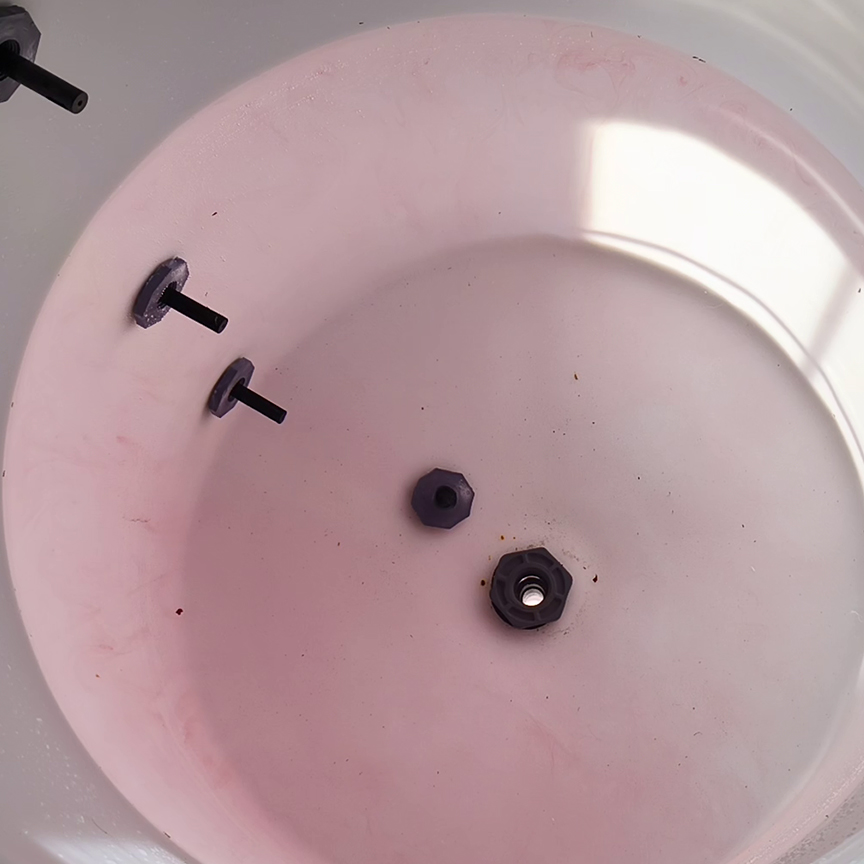
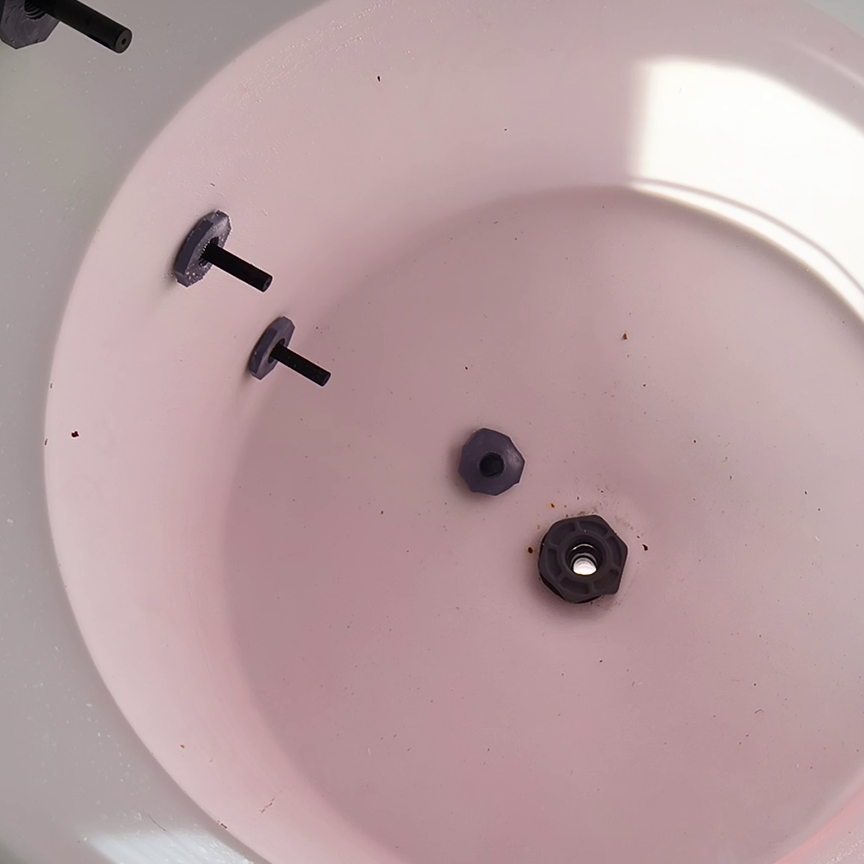
| Time = 0 | Time = 1.5 minutes | Time = 3 minutes |
 |  |  |
| 200L Full Working Volume | ||
|---|---|---|
| Time = 0 | Time = 1.5 minutes | Time = 3 minutes |
 |  |  |
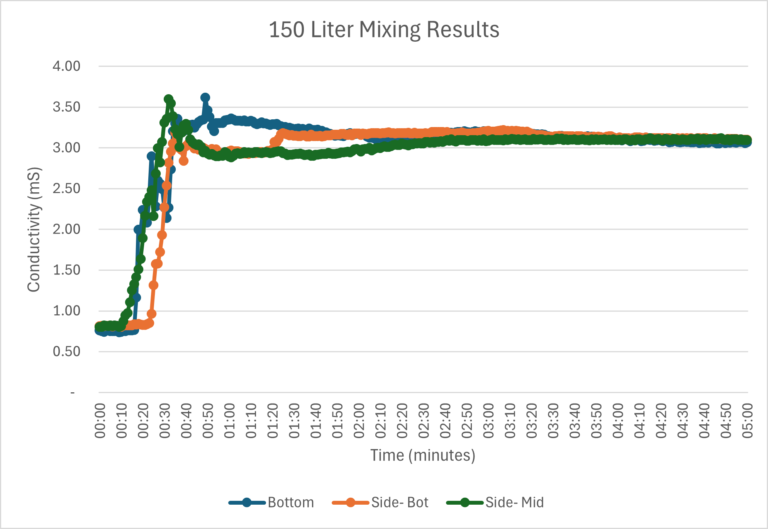
| 150L Working Volume | ||
|---|---|---|
| Time = 0 | Time = 1.5 minutes | Time = 3 minutes |
 |  |  |
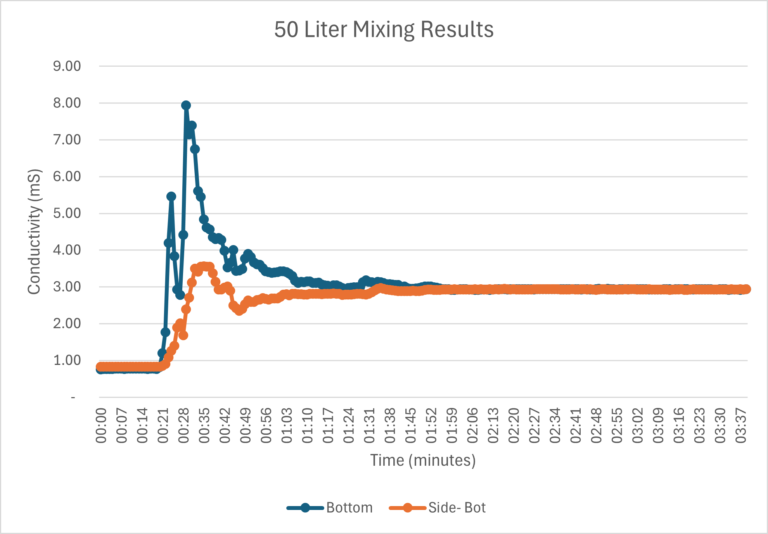
| 50L Working Volume | ||
|---|---|---|
| Time = 0 | Time = 1.5 minutes | |
 |  | |
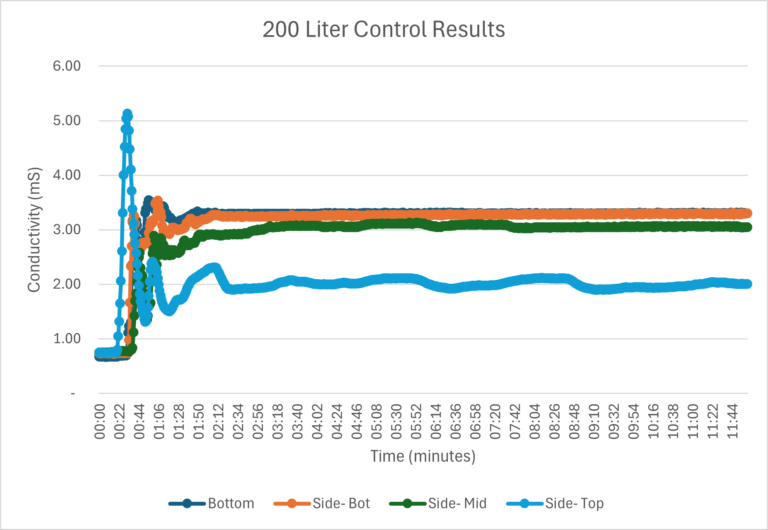


| Control | ||
|---|---|---|
| Time = 0 | Time = 1.5 minutes | Time = 3 minutes |
| | |
| 200L Full Working Volume | ||
|---|---|---|
| Time = 0 | Time = 1.5 minutes | Time = 3 minutes |
| | |
| 150L Working Volume | ||
|---|---|---|
| Time = 0 | Time = 1.5 minutes | Time = 3 minutes |
| | |
| 50L Working Volume | ||
|---|---|---|
| Time = 0 | Time = 1.5 minutes | |
| | |